J. McCulough1, H. Marcus2, H. Keller3
1. Department of Kinesiology, University of Waterloo, Canada; 2. Clinical Nutrition Services, Grand River Hospital, Kitchener, ON, Canada; 3. Schlegel-University of Waterloo Research Institute for Aging, University of Waterloo, Canada.
Corresponding to: Heather Keller, Schlegel-University of Waterloo Research Institute for Aging, University of Waterloo, Canada, hkeller@uwaterloo.ca
Care Weekly 2017;1:31-40
Published online November 9, 2017, http://dx.doi.org/10.14283/cw.2017.7
Please, note that this editorial was published also in the Journal of the Nutrition Healh and Aging (JNHA) https://link.springer.com/article/10.1007/s12603-017-0890-7
Abstract
Objectives: Barriers to food intake (FI) exist in hospital that could exacerbate insufficient FI and malnutrition. The Mealtime Audit Tool (MAT) is a staff-administered clinical assessment tool to identify FI barriers for individual patients. Two studies were completed. The objectives of the first study were to test a draft version of the tool and characterize barriers to food intake in older adults in four diverse hospitals, while the second study aimed to demonstrate the inter-rater reliability of the revised MAT.
Design: Multi-site, cross sectional. Setting: Four acute care hospitals in Canada.
Participants: Study 1: 120 older (65+ years, adequate cognition) medical or surgical patients. Study 2: 90 medical or surgical patients.
Measurements: In study 1, participants had barriers experienced at one mealtime assessed with MAT. Descriptive analyses characterized the prevalence of barriers across the hospitals. Revisions were made to the MAT based on recommendations from sites. A revised version was tested for inter-rater reliability in study 2. Intraclass correlation coefficient (ICC) was calculated for total MAT scores from 90 patient meals assessed by two raters. Kappa statistics were calculated for each of the 18 MAT items.
Results: Mean (+/- standard deviation) number of barriers experienced in Study 1 was 2.93 +/- 1.58, and in Study 2 was 2.51 +/- 1.19. The revised MAT was reliable with an ICC of 0.68 (95%CI: 0.52-0.79). Ten of 16 items in which kappa could be calculated had at least fair agreement.
Conclusion: MAT is sufficiently reliable when used by auditors with minimal training. Routinely auditing mealtimes with MAT could be useful in identifying and removing barriers to food intake for older hospitalized patients.
Key words: Food intake, barriers, hospital, assessment.
Introduction
Malnutrition is a prevalent and significant issue in hospital, especially among older patients (1-3) with prevalence approaching 70% (4-7). As malnutrition affects several patient outcomes and results in increased lengths of stay and cost of care (5, 8, 9), means of improving nutritional status while in hospital are a worthwhile area of study. Poor food intake during hospitalization is common (10) and can lead to or perpetuate malnutrition; insufficient (i.e., ≤ 50%) food intake (FI), regardless of nutritional state, is an independent predictor of length of stay (4).
Within the past decade research has emerged (11-16) identifying barriers to FI, which are issues or challenges that patients experience that further prevent them from consuming enough food while in hospital. Physical barriers include issues such as: difficulty cutting food/opening packages, being unable to reach the meal tray, or being in an uncomfortable eating position (11, 16). Organizational barriers may include a broad range of issues: food being served at inconvenient times; patients receiving the wrong foods; hot foods not being served hot; dissatisfaction with food quality; distracting eating environments due to excessive noise; unpleasant odours; or being interrupted during meals (11, 16). Up to 70% of patients describe experiencing these barriers (16) with older adults and those who are malnourished being more susceptible. Others have also suggested that the frail elderly patient may be more disposed to experiencing these physical and organizational barriers to food intake (15, 17). To date, no standardized tool has been developed and tested to systematically identify barriers to food intake. Availability of such a tool would support routine examination of mealtime barriers in hospital and could stimulate changes in care practices and protocols.
The Mealtime Audit Tool (MAT) is an interview-based questionnaire designed to be completed by a hospital staff member to identify barriers that individual patients may encounter during a mealtime. The first page of the tool describes the unit, meal service and provides a space for qualitative comments that can be used to understand the context of the meal that day on the unit (e.g. was a crisis happening). The second page is completed with individual patients; the interviewer asks them 18 questions based on their meal experience. Outcome of the meal, such as food intake, is not recorded. MAT takes approximately 10 minutes to complete. The MAT was created to support the recently developed Integrated Nutrition Pathway for Acute Care (INPAC), an evidence and expert consensus-based set of best practice guidelines for nutrition care in acute care hospital patients (18). The aim of INPAC is to standardize practices to better detect, monitor, and treat malnutrition in the acute care population. INPAC’s recommendations include the identification of FI barriers and their removal to promote food intake (18). The primary aim of this research was to develop a feasible and easy to complete questionnaire (study 1) and determine whether the MAT had sufficient inter-rater reliability (study 2) for use in practice.
Methods
Subjects and Hospitals
Study 1 was part of a multi-component project focused on frail older adults admitted to hospital. The objective of this project was to test three clinical resources that were developed to support the use of INPAC for feasibility, one of which was the MAT. In the study, 120 medical or surgical patients were enrolled from four Canadian hospitals (n=30 per site). Eligible patients were: over 65; admitted from and likely to be discharged home; admitted to a medical or surgical unit; able to speak/read English or French; not cognitively impaired (as assessed by nursing for ability to complete written consent); likely to be admitted for 2-5 days; and consuming an oral diet. Adults over the age of 65 years were specifically targeted due to the acknowledgement that most medical and surgical patients are older adults; it was assumed that if MAT was feasible with older adults, it would be feasible with younger patients as well. The objective of study 1 was to determine how to improve the draft MAT prior to reliability testing. A secondary objective was to characterize barriers to intake for older adults in these four hospitals using MAT. The participating hospitals were diverse in terms of region, type, size, and primary language (Table 1). Each site had centralized plating of food with either hot delivery or retherm, and bedside tray service, typically provided by a food service worker; the majority of food products were ready-prepared (i.e. produced outside of the hospital). It was anticipated that completion of the MAT with 30 patients in each hospital would provide a sufficient range of experience with the draft tool to allow for a quality revision. Revisions made are discussed in the results section.
After completion of study 1, revisions were made to the MAT and in study 2 the revised version was tested for inter-rater reliability. Study 2 was conducted at one hospital (Site #3 –Table 1). This site was in close proximity to the research institution and had available dietetic interns who could complete the interview-administered MAT for many patients in a short time frame as part of their course of training. Ninety patients from medical and surgical units were enrolled at 30 different mealtimes and completed the audit. Eligible patients were: over the age of 18 years, able to speak English, competent and able to provide informed consent, on an oral diet and interested in participating in the study for a single meal. As it was known that MAT could be completed with other adults who were cognitively well from study 1, the eligibility criteria by age was expanded to promote data collection completion in the short time allowed by the dietetic intern training program.
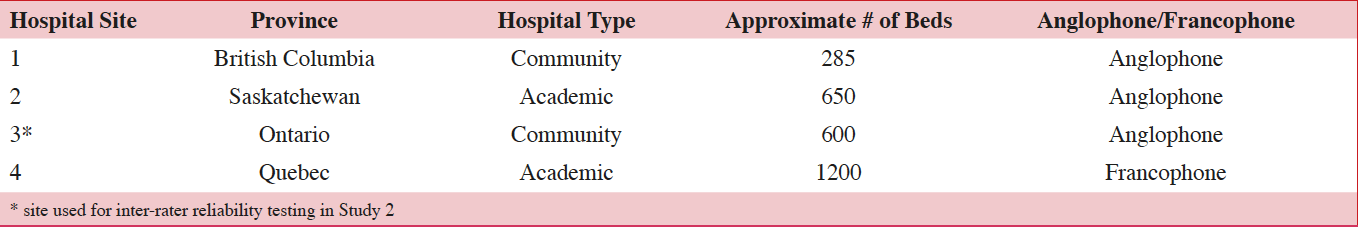
Table 1: Participant Hospital Characteristics for Study 1 and 2
Mealtime Audit Tool (MAT)
The MAT is essentially a checklist of FI barriers, intended to be completed through interview with patients immediately after a meal. Initial development included a scan of the literature to identify common FI barriers for acute care patients (11, 12, 14, 16). The draft MAT was developed with leading nutrition clinicians and researchers and face validated (19) by five clinician experts, who provided further insight on content, presentation, terminology and instructions to promote consistency in use.
On version 1 of the two-page tool (used in study 1), the first page included a section for the auditor to record any environmental observations that could have impacted the mealtime. The second page contained a checklist of patient-specific barriers an individual patient may have experienced during the meal. Each question on the second page of the MAT had a Yes or No response option, with ‘No’ indicating that a barrier had been encountered (e.g. “Received the food they ordered?”; ‘No’ indicates the patient did not receive the food they ordered and therefore represents a potential barrier for that meal). A comment area was provided for interviewers, so that they could provide clarification for patient responses. The ‘No’ responses were summed at the bottom of the page resulting in a total MAT “score”.
To complete the MAT, the site research dietitian was trained to observe the unit before and during the meal to note any general environmental barriers across the unit (e.g. excess noise, emergency, patient transfers etc.). They recorded these general unit level observations on page one. They then met with the recruited patients to complete the second page to determine which of the barriers were encountered by these specific patients (n=120).
The initial feasibility testing in study 1 of the MAT identified that minor changes to the tool were required in order to promote consistency. The revised version included a more open-ended section on the first page for the auditor to note the potential unit-level barriers observed. Changes were also made to the second page of the MAT. A “not applicable” option was added where appropriate as it was noted that some questions were left blank when the most appropriate response was ‘not applicable’. The site research dietitians further suggested the removal of items that they determined were not actually barriers to intake, while suggesting additional challenges they observed at their site. The wording of the barriers was also modified so that the person interviewing patients could read them verbatim, further promoting consistency. Finally, the comment section was reduced as it was rarely used. The suggested changes resulted in a revised version, which was used in the data collection for the inter-rater reliability testing (study 2).
Data Collection
Ethics clearance for the data collection was obtained through a University of Waterloo Research Ethics Committee as well as through the ethics boards of each individual hospital involved. In study 1, four research dietitians (one per hospital) completed the descriptive data collection, recruiting eligible patients from medical and surgical units. They were trained via teleconference over a three-month period, and communicated with the project team on a regular basis via email and teleconference to address any questions with respect to the study. Data collection occurred over a 2-4 month period for each site. Nursing staff who were part of the circle of care identified eligible patients and made the initial approach to gain their assent to have the research dietitian approach them to complete informed written consent. During the designated meal at which MAT was to be completed for a participant(s), the research dietitian observed the entire unit and completed the first page of the tool, noting any unit-level barriers. After the participant had finished his/her meal, the dietitian completed the second page of the MAT by interviewing the patient.
Data collection for study 2 was conducted by two dietetic interns who both completed MAT with each patient at a single meal. The interns were trained by Site 3’s research dietitian on how to complete MAT. Written informed consent was obtained immediately prior to the meal that was being audited and the demographic questions completed at that time. After participants completed their meal, the first intern entered their room and completed the MAT questions. Fifteen minutes later, the second intern completed MAT with the participant. The dietetic interns were blinded to each other’s results and the order of who completed MAT with a particular participant varied. On average three participants were assessed per meal (range: 1-7 participants assessed per meal across the 30 mealtimes).
Analysis
In studies 1 and 2, descriptive analyses were performed to determine the mean (s.d.) total MAT score (i.e. number of barriers experienced per patient) per hospital site, and the most common barriers experienced across the hospital sites. One-way ANOVA analyses determined whether there were significant differences in the average number of barriers experienced by patients among the hospital sites. Descriptive analyses were also completed to characterize the two samples of participants. T-tests and Z-tests were used to compare the two samples on descriptive variables. Chi square analyses were performed to determine whether there were any associations between patient demographic characteristics (gender, unit type, age, education) collected and whether patients experienced In study 2, with the sample size of 90 participants, it was determined that the smallest possible correlation that the sample was powered to detect (α=0.05) would be 0.35 (20, p.79). The primary method of determining inter-rater reliability was by comparing the total MAT score for first and second administrations for each participant. An intraclass correlation coefficient (ICC) was calculated using a two-way random model of absolute agreement (21) to determine how well the scores between raters were correlated. An ICC value greater than 0.75 was considered “excellent”, 0.60-0.74 “good”, 0.40-0.59 “fair”, and 0.75 were considered “excellent”, values between 0.40-0.75 “fair to good”, and
Results
Patient Characteristics
The demographic characteristics of the participants from study 1 and study 2 are displayed in Table 2. Both samples had the same gender distribution (male: 43%(n=52); female: 57% (n=68)). Study 1 sample was older (78.4 +/- 8.4 years) than study 2 (67.6 +/- 14.3 years) (t=102.642, p<0.001). The majority of study 1 participants (77.5% n= 94) were from medical units, while the majority of study 2 participants (53.3% n=48) were from surgical units (z=4.754, p<0.0001). No other characteristics were significantly different between study 1 and 2 samples. Most participants in both studies had at least a high school education (study 1: 62.5%, study 2: 71.2%). The most common reasons for admission in both samples were for orthopedic conditions (study 1: 22.5% (n=27), study 2: 40% (n=36)).
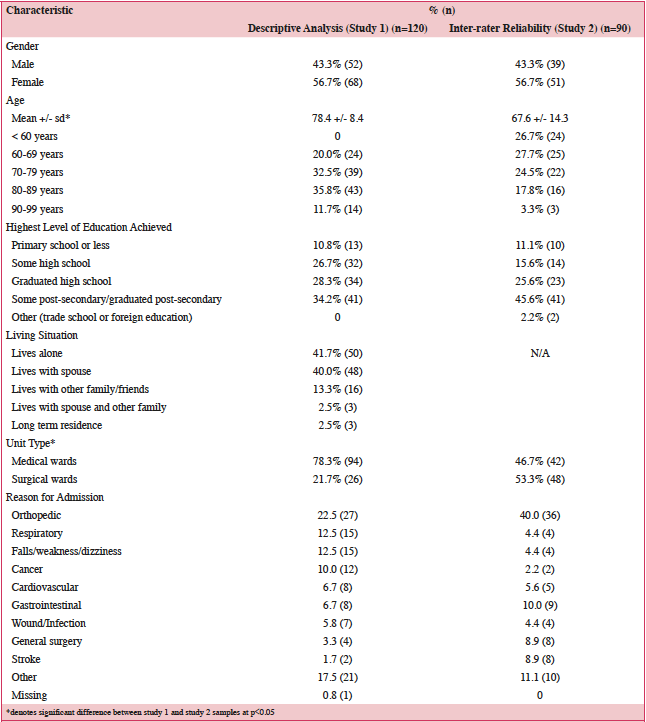
Table 2: Patient Demographics study 1 and study 2
Study 1: Descriptive Analysis of Mealtime Barriers
The mean number of FI barriers experienced per patient in study 1 was 2.93 +/- 1.58 and in study 2 (considering both raters) was 2.51 +/- 1.19. A comparison of barriers experienced across the four hospitals from study 1, along with those from study 2, are displayed in Table 3. According to Tukey post-hoc tests, the only statistically significant difference among the study 1 hospitals was between Site 4 (mean=3.70 +/- 1.21 barriers experienced) and Site 2 (mean=2.37 +/- 1.92) (F=4.039, p=0.009). Study 2 had a greater proportion of females than males who experienced three or more barriers (51.0% (n=26) vs. 28.2% (n=11); X2=4.735, p=0.03). Those with less than a high school education in study 2 were also more likely to have experienced three or more barriers than those with at least a high school education (58.3% (n=14) vs. 34.8% (n=23); X2=4.010, p=0.045). However, differences by patient characteristics were not found in study 1 (Table 4).

Table 3: Descriptive analysis for barriers experienced by patients across hospital sites and studies
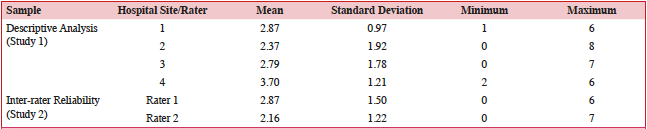
Table 4: Comparison of number of barriers experienced by selected patient characteristics
The proportions of patients from study 1 that experienced each FI barrier listed on the MAT are displayed in Table 5. The most common barriers experienced in this sample included: food intake/hydration not monitored at the meal (71.3% n=77); patient not visited by staff mid-meal for a check (54.3% n=63); not offered snacks in between meals (52.9% n=63); food did not look or smell appetizing (24.4% n=29); and food not served hot (16.9% n=20). Despite being the most common barrier identified in study 1, “food intake/hydration not monitored at the meal” was removed for version 2 of the MAT because it was considered more of a nutrition care activity than a barrier to intake. The most common barriers experienced in study 2 (Table 6) were: patient not offered help with meal (70.7% n=63); not visited by staff mid-meal for a check (57.9% n=51); meal did not come at an appropriate time for the patient (26.7% n=24); meal did not look and smell appetizing (20.0% n=18); and not being offered help to use the washroom before the mealtime (14.9% n=13).
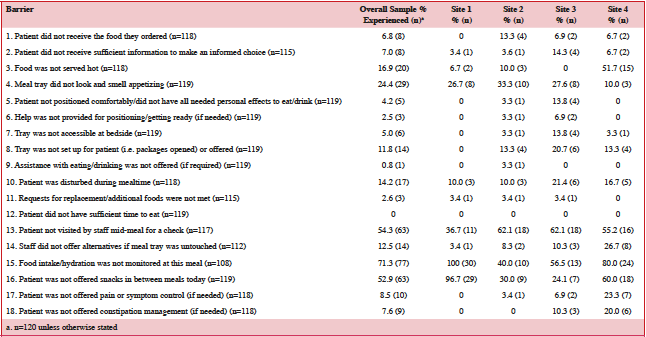
Table 5: Prevalence of food intake barriers experienced by study 1 participants (MAT Version 1)
A large difference in prevalence was noted between study 1 and 2 for item 9 as the wording was changed after study 1 in an attempt to make it into a question posed verbatim to the patient (“If required, assistance with eating/drinking was offered” vs. “Were you offered any help with your meal?”). The proportion of participants who indicated this was a barrier in study 1 was 0.8% (n=1)(Table 5), while in study 2 the proportion that indicated it was a barrier (averaged between both raters) was 70.7% (n=63) (Table 6). The increased prevalence reported in study 2 suggests that the wording was not specific to those who required assistance. Additionally, absolute agreement between auditors for item 9 in study 2 was <80% (the only item to be this low) and thus revision was deemed necessary for the final version. Final revisions, including item 9 are noted below.
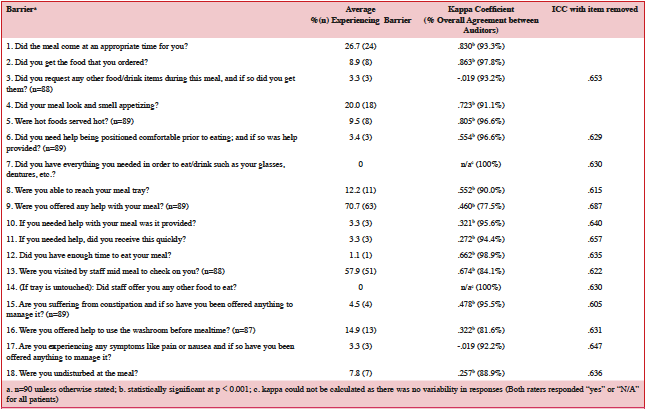
Table 6: Prevalence of mealtime barriers and reliability results for study 2 participants (MAT Version 2)
Inter-rater Reliability
The ICC for total MAT score between the two raters was 0.68 (95% CI=0.52-0.79), indicating good agreement. Table 6 shows the kappa correlation coefficients for each barrier item as well as the proportion of agreement in responses between raters. The third column displays the new ICC for total MAT score when each barrier with a low kappa (<0.70) was removed. Most individual items had good to excellent agreement. The mean number of questions with exact agreement between the two raters for each patient was 15.66 +/- 1.70 out of 18. The median and mode number of matches between raters for each patient was 16 and 17 barriers, respectively, with values ranging from 12 matches to 18 matches per patient. The negative kappa for items 3 and 17 were likely a result of the minimal variance in responses, as noted by the 93.2% and 92.2% agreement between auditors for these items, respectively. Similarly, kappa for items 7 and 14 could not be determined due to absolute agreement (100%) in responses between raters. When items with moderate to low kappas were removed from the total MAT score count, none of the re-calculated ICCs were statistically different from the original ICC of 0.68, according to an F-test. Thus all 18 items from study 2 were retained.
Revisions Made to MAT
After completion of study 2, the researchers met to review in detail with the dietetic interns how to further improve the MAT. On page one, questions were added to provide a better description of the meal timing. In relation to the issue with item 9 described above, it was noted that items 10 and 11 were only relevant if item 9 indicated that the patient needed help, so these questions were amalgamated to read: a) “Are you able to eat your meal without help?”, and b) “If staff helped you, did you get help when you wanted it? N/A if no help provided by staff”. Item 8 (“Were you able to reach your meal tray?”) was revised to include a component on opening packages and was changed to read: a) “Were you able to reach your tray?”, and b) “Were you able to open your food packages OR did you get help to open packages?”). Item 18 was changed from “Were you undisturbed at the meal?” into two separate items in an effort to better distinguish between types of disturbances experienced by a patient. The published version now includes: “Were you able to eat your meal without interruptions (e.g. doctor, nurse, physical therapist visiting)?” and “Was your meal free from noise, cleaning or other disturbances?”. Finally, relatively few comments were provided by interviewers with respect to each MAT item, thus this portion of the tool has been reduced. With these revisions, the final version of the MAT contains 17 questions; the tool along with a guidance document for health care providers can be found at: www.nutritioncareincanada.ca/resources.
Discussion
This study has shown that the Mealtime Audit Tool, an assessment of FI barriers experienced by patients, has sufficient reliability. The estimated ICC of 0.68 is considered to be in the ‘good’ range while the 95% CI of 0.52-0.79 falls in the range of fair to excellent (22). Revisions to the MAT using feedback from auditors in the two studies have made the tool more user-friendly and ensured that relevant barriers were included in the final version. This is the first study that has developed such a tool for clinical practice. Naithani et al. (12) developed a similar questionnaire measure for research and characterized barriers experienced throughout the hospital stay (16), as opposed to a single mealtime; recall across the time frame of hospitalization could increase the risk of recall bias in patient responses.
The MAT was designed for clinical practice and is a tool that can be used to support a change in nutrition care. However, it is focused on the process of mealtime and not potential outcomes such as food intake, satisfaction or quality of life. The aim of identifying barriers in nutritionally at-risk patients would be to then ensure that these barriers are removed to maximize patients’ potential for sufficient FI. This could include removing physical barriers, like staff helping patients with positioning or with opening packages. Or if organizational barriers (e.g. incorrect food items being delivered, patients disturbed, etc.) are commonly identified across a unit/hospital, this could signal that food service practices may need to be improved.
Building upon this initial reliability testing, it would be worthwhile to conduct further inter-rater reliability testing on the final revised version of the MAT using the methodological improvements suggested below across a wider range of hospital sites. Process issues such as determining whether the MAT could be implemented into routine practice and how MAT audits would result in changes in practice need to be determined; a developmental evaluation of an implementation project is currently underway to identify feasible processes.
Strengths and Limitations
The descriptive analyses conducted add to the currently limited knowledge base of the prevalence and existence of mealtime barriers, however the samples used in both studies cannot be considered representative of the units, hospitals or regions. However, samples were of sufficient size and diversity to address the research questions. Some statistically significant differences in barriers experienced by subgroups of patients were identified, but further samples would need to confirm these differences before conclusions can be made. The order in which the dietetic interns audited each participant in study 2 was not recorded, although they were instructed to vary their order. It would have been prudent to record rater order to rule out any effect this may have had on total MAT score as well as the exact time these were completed; the auditors were trained to have a minimum of 15 minutes between interviews. Further, a larger study of reliability could also consider patient characteristics, like age, that may affect reliability of reporting. Going through the questions a second time may have also caused some participants to over-analyze their mealtime experience and identify barriers they might not have had initially. If this was the case, this would have lowered reliability and thus the estimated ICC is believed to be conservative. The hospital site (Site 3) in which the inter-rater reliability testing was conducted is a higher centre of nutrition care than most hospitals as they have conducted nutrition research in the past and mentor several dietetic trainees each year. This hospital has diet technicians on staff within its units, and therefore may have a higher capacity for nutrition care than most. However, there was no difference in barriers experienced in Site 3 compared to the other three hospitals in study 1. A research team that involved clinicians and users of the tool were involved in developing, revising and finalizing the tool, promoting its clinical utility. Yet, revision was still required after study 2. Further reliability testing of this final version is warranted.
Conclusions
This research demonstrated that the MAT is reliable when used by auditors with minimal training. The MAT is a novel measure of FI barriers, which are not regularly or systematically monitored in most hospital units today. An audit tool such as the MAT may help hospital management to identify common barriers on specific units, providing them with tangible evidence on where they can improve care. As FI is essential to recovery and impacts length of stay (4) it is relevant to assess and remove barriers in order to give patients the best opportunity to achieve sufficient FI.
Funding
This research is funded by TVN, which is supported by the Government of Canada through the Networks of Centres of Excellence (NCD) program.
Conflict of Interest
Authors declare no conflicts of interest.
Ethical standard
Clearance for the conduct of this study was provided by a Univeristy of Waterloo Ethics Review Committee as well as REB at each hospital.
References
1. Morley JE. Protein-energy malnutrition in older subjects. Proc Nutr Soc 1998;57: 587-592.
2. Hickson M. Malnutrition and ageing. Postgrad Med J 2006;82: 2-8.
3. Young AM, Kidston S, Banks MD, Mudge AM, Isenring EA. Malnutrition screening tools: Comparison against two validated nutrition assessment methods in older medical inpatients. Nutrition 2013;29:101-106.
4. Allard J, Keller H, Jeejeebhoy K, Laporte M, Duerksen DR, Gramlich L, Payette H, Bernier P, Vesnaver E, Davidson B, Teterina A. Malnutrition at hospital admission – Contributors and effect on length of stay: A prospective cohort study from the Canadian Malnutrition Task Force. J Parenter Enteral Nutr 2016;40(4): 487-497.
5. Isabel M, Correia MI, Waitzberg DL. The impact of malnutrition on morbidity, mortality, length of hospital stay and costs evaluated through a multivariate model analysis. Clin Nutr 2003;22(3): 235-239.
6. Corish CA, Kennedy NP. Protein-energy undernutrition in hospital in-patients. Br J Nutr 2000;83:575-591.
7. Ray S, Laur C, Golubic R. Malnutrition in healthcare institutions: A review of the prevalence of under-nutrition in hospitals and care homes since 1994 in England. Clin Nutr 2014;33: 829-835.
8. Agarwal E, Ferguson M, Banks M, Batterham M, Bauer J, Capra S, Isenring E. Malnutrition and poor food intake are associated with prolonged hospital stay, frequent readmission, and greater in-hospital mortality: Results from the Nutrition Care Day Survey 2010. Clin Nutr 2013;32:737-745.
9. Lim SL, Ong KCB, Chan YK, Loke WC, Ferguson M, Daniels L. Malnutrition and its impact on cost of hospitalization, length of stay, readmission and 3-year mortality. Clin Nutr 2012;31:345-350.
10. Dupertuis YM, Kossovsky MP, Kyle UG, Raguso CA, Genton L, Pichard C. Food intake in 1707 hospitalised patients: a prospective comprehensive hospital survey. Clin Nutr 2003;22(2):115-123.
11. Naithani S, Whelan K, Thomas J, Gulliford MC, Morgan M. Hospital inpatients’ experiences of access to food: a qualitative interview and observational study. Health Expect 2008;11:294-303.
12. Naithani S, Thomas JE, Whelan K, Morgan M, Gulliford MC. Experiences of food access in hospital. A new questionnaire measure. Clin Nutr 2009;28:625-630.
13. Bell J, Bauer J, Capra S, Puile CR. Barriers to nutritional intake in patients with acute hip fracture: time to treat malnutrition as a disease and food as a medicine? Can J Physiol Pharmacol, 2013;91:489–495.
14. Dickinson A, Welch C, Ager L. No longer hungry in hospital: improving the hospital mealtime experience for older people through action research. J Clin Nurs 2008;17:1492–1502.
15. Naithani S, Whelan K, Thomas JE, Gulliford MC. Multiple morbidity is associated with increased problems of food access in hospital: a cross-sectional survey utilising the Cumulative Illness Rating Scale. J Hum Nutr Diet 2010;23:575-582.
16. Keller H, Allard J, Vesnaver E, Laporte m, Gramlich L, Bernier P, Davidson B, Duerksen D, Jeejeebhoy K, Payette H. Barriers to food intake in acute care hospitals: a report of the Canadian Malnutrition Task Force. J Hum Nutr Diet 2015;doi:10.1111/jhn.12314
17. Keller H, Vesnaver E, Davidson B, Allard J, Laporte M, Bernier P, Payette H, Jeejeebhoy K, Dureksen D, Gramlich L. Providing quality nutrition care in acute care hospitals: perspectives of nutrition care personnel. J Hum Nutr Diet, 2013;doi:10.1111/jhn.12170
18. Keller HH, McCullough J, Davidson B, Vesnaver E, Laporte M, Gramlich L, Allard J, Bernier P, Duerksen D, Jeejeebhoy K. The Integrated Nutrition Pathway for Acute Care (INPAC): Building consensus with a modified Delphi. Nutr J 2015;14: 63-74.
19. Streiner DL, Norman GR. Health Measurement Scales – A Practical Guide to their Development and Use. Oxford Medical Publications, Oxford University Press Inc., New York, 1995;p. 58-59, 147-150.
20. Hulley SB, Cummings SR, Browner WS, Grady DG, Newman TB. Designing Clinical Research – Fourth Edition. Lippincott Williams & Wilkins, Philadelphia, 2013;p.79.
21. Shrout PE, Fleiss JL. Intraclass correlations: Uses in assessing rater reliability. Psychol Bull 1979;86(2):420-428.
22. Cicchetti DV, Sparrow SS. Developing criteria for establishing the interrater reliability of specific items in a given inventory. Am J Ment Defic 1981;86:27-137.
23. Donker DK, Hasman A, van Geijn HP. Interpretation of low kappa values. Int J Biomed Comput 1993;33:55-64.
24. Jones JM. Reliability of nutrition screening and assessment tools. Nutrition 2004;20:307-311.