Vitality, Medicine & Engineering Journal

AND option

OR option

FRAILTY AND FEAR FALLING: THE FISTAC STUDY


M. Esbri-Victor1, I. Huedo-Rodenas1, M. Lopez-Utiel1, J.L. Navarro-Lopez1, M. Martinez-Reig1, J.A. Serra-Rexach2,3, L. Romero-Rizos1,2, P. Abizanda1,2


1. Geriatrics Department. Complejo Hospitalario Universitario de Albacete, Albacete, Spain; 2. CIBERFES, Instituto de Salud Carlos III, Madrid, Spain; 3. Geriatric Department. Hospital General Universitario Gregorio Marañón, Madrid, Spain.
Corresponding author: Pedro Abizanda, MD, PhD. Geriatrics Department. Complejo Hospitalario Universitario de Albacete, 02006 Albacete, Spain. e-mail: pabizanda@sescam.jccm.es, Tfn: +34967597651; Fax : +34967597635.

Care Weekly 2017;1:50-55
Published online November 9, 2017, http://dx.doi.org/10.14283/cw.2017.9

Please, note that this editorial was published also in the Journal of Frailty Aging (JFA) http://dx.doi.org/10.14283/jfa.2017.19


Abstract

Objective: To analyze the association between frailty and Fear of Falling (FoF) in a cohort of older adults with previous falls. Design: Cross-sectional study (FISTAC). Setting: Falls Unit, Complejo Hospitalario Universitario of Albacete (Spain). Participants: 183 adults older than 69 years, from the Falls Unit, with a history of a previous fall in the last year. Measurements: FoF was assessed at baseline using the Falls Efficacy Scale International (FES-I) and three questions previously validated.  Frailty was assessed with the frailty phenotype criteria. Age, gender, comorbidity, nutritional status, cognitive status and risk of depression were determined. Results: Mean age 78.4, 80.3% women. FoF was present in 140 (76.5%) participants with the three questions and 102 (55.7%) presented high concern of falling with the FES-I. 88.8% of frail older adults presented FoF compared to 62.4% of those who were not frail, and only 37.8% of non frail had a high concern of falling, compared to 77.2% of those who were frail measured with the FES-I. Frail participants had an adjusted risk of FoF that was 3.18 (95% CI 1.32 to 7.65) higher compared to those who were not frail assessed with the three questions and 3.93 (95% CI 1.85 to 8.36) higher concern of falling when using the FES-I scale. Only female sex and depression risk were also associated to FoF in the final adjusted models. Conclusion: Frailty is independently associated with the FoF syndrome in older faller subjects.

Key words: Frail elderly, fear of falling, falls, older adults.


Introduction

Physical frailty is a medical syndrome with multiple causes and contributors that is characterized by diminished strength, endurance, and reduced physiologic function that increases an individual’s vulnerability for developing increased dependency and/or death (1). Frailty is a common syndrome in community-dwelling older adults with a pooled prevalence of 10.7% (2), and a it has been associated with health related adverse events like mortality, disability in basic activities of daily living (BADL) and mobility disability, hospitalization, institutionalization and falls (3).
The Fear of Falling (FoF) syndrome refers to the lack of self-confidence that normal activities can be performed without falling (4). It has been identified as a common problem affecting between 20.8 and 80% of community-dwelling older adults (5-8), and may be associated with a history of previous falls (6,9), although it can also be present in older adults without previous falls (8,10). Individual factors associated with FoF are older age (6,9), female sex (5,8), polypharmacy (6), obesity (7), vision problems (11), balance and mobility impairment (7,11), activity levels (12), social isolation and living alone (7), low self-rated health (11), cognitive impairment (7), anxiety and depression (5,6,13). FoF has also been associated with potentially serious outcomes including reductions in physical activity, reduced ability to perform activities of daily living, abandon of social activities, worse quality of life, and increase in future falls (14,15).
Frailty is associated with falls (16) through a multicomponent causality including sarcopenia-related weakness, weight loss-related sarcopenia and low physical activity-related sarcopenia (17). Moreover, slowness and exhaustion can produce exercise and rehabilitation avoidance, increasing sarcopenia, balance impairment and falls. Although slowed gait speed, shorter stride length, and an increased double support phase, all related to the frailty phenotype, are associated with falls and FoF, there is no clear evidence that the frailty syndrome is associated with FoF. Indeed, few studies have analyzed the association between these two syndromes (18).


Methods

Objective

The main objective was to analyze the association between frailty and FoF in older adults in Spain.

Design

Cross-sectional analysis of the FISTAC Study (Identification of the Physical Attributes of the Fear of Falling Syndrome).

Population

Inclusion criteria were patients ≥70 years old, with at least a previous fall in the last year, who were visited at the Falls Unit of the Geriatrics Department, Complejo Hospitalario Universitario of Albacete (Spain). The complete protocol can be accessed in a previous publication (19). Written informed consent was necessary prior to enrollment in the study.

Fear of Falling assessment

FoF was assessed at baseline using two validated methods. The first one was the assessment of three questions that have been previously published (12) and used in other studies (7). Participants had to respond yes or no to the following questions: 1. Are you afraid of falling? 2. Do you limit any household activities because you are frightened you may fall? and 3. Do you limit any outside activities because you are frightened you may fall? If the response to any of the three questions was positive, the patient was classified as having FoF. These questions have been independently associated with activity restriction (12), balance and mobility impairment (7), and responses to similar questions correlate with the Falls Efficacy Scale.
The second method was the Falls Efficacy Scale International (FES-I) (20). This instrument evaluates the level of concern about FoF in several activities of daily living. It includes 16 items scoring between 1 and 4, being 1 the absence of concern and 4 the greatest concern. The scoring range of the complete scale is between 16 (no concern at all) and 64 (greatest concern). Scores between 16 and 19 reflect a low concern of FoF, between 20 and 27 moderate concern, and greater than 27 high concern (21).

Frailty assessment

We used the frailty phenotype criteria (22). 1. Unintentional weight loss ≥ 4.600 Kg or ≥ 5% of body weight in the last year. 2. Weakness as measured by grip strength, using a JAMAR® hand dynamometer, in the lowest 20%, adjusted for gender and body mass index, according to the Fried’s original cut-offs. 3. Poor energy and endurance, as indicated by self-reported exhaustion determined by two questions from the Center of Epidemiologic Studies Depression Scale. 4. Slowness, measured as the time taken to walk 4.0 meters, within the lowest 20th percentile and adjusted for gender and height, according to Fried’s original cut-offs. 5. Low physical activity level, calculating the number of kilocalories expended weekly from information given by the patient using the Calcumed® instrument, within the lowest quintile for each gender, with Fried’s original cut-off points. To construct the frailty phenotype variable, participants had to have valid values in at least 3 of the 5 criteria. Subjects were considered frail if three or more criteria were present and pre-frail if 1 or 2 were present. Frailty was analyzed as a dichotomic variable (yes/no), and every five criteria were also analyzed independently.

Study covariables

Age and gender were recorded, and chronic diseases were identified from the medical records of participants. Diseases were codified following the CIE-10 classification, and comorbidity was analyzed with the Charlson index. High comorbidity was considered when Charlson index score was equal or greater than 3 points. Cognitive status was determined with the Folstein´s Mini Mental State Examination (MMSE), and risk of depression with the Geriatric Depression Scale from Yesavage (GDS). Cognitive impairment was considered when MMSE was lower than 24 points and depression risk when GDS was higher than 4 points. Nutritional status was measured with the Mini Nutritional Assessment Short-Form (MNA®-SF), a 6-item scale that assesses nutritional risk, ranging from 0 (poorer nutritional state) to 14 (better nutritional state). Risk of malnutrition was considered with scores below 12 points. For study purposes, weakness and slowness were also categorized according to validated European Working Group on Sarcopenia in Older Adults (EWGSOP) criteria as follows: Weakness < 20 kg in women or < 30 kg in men, and slowness as usual gait speed < 0.8 m/s in both men and women.

Information sources

After the informed consent sign, information was collected through a single, one-to-one interview with the participant at the Falls Unit. The information was provided by the participant him/herself. The performance tests were conducted on the same day as the interview. The information on the participants’ chronic diseases was collected from the hospital medical records. Data were anonymized, codified and included in a data base for further analysis.

Ethics

This study complies with the Declaration of Helsinki and with the Organic Personal Data Protection Spanish Law 15/1999. The study was approved by the Institutional Review Board of the Albacete Health Area and the Clinical Research Committee of the Complejo Hospitalario Universitario de Albacete. All participants gave their written signed consent before being included in the study.

Statistics

A descriptive analysis of the subjects’ characteristics was performed using proportions and measures of central tendency and dispersion according to the nature of the variables. Subsequently, a bivariate analysis was performed using the Chi-squared tests and t-Student tests to determine differences in study variables according to the FoF status. Last, we conducted a multivariate analysis with logistic regression models to describe the variables independently associated with FoF. In the models we included progressively frailty, age, sex, Charlson index, MMSE, GDS and MNA®-SF. In these models, frailty was only analyzed as a dichotomic variable (yes/no) because the proportion of non-frail participants was very small our patients with recurrent falls. All data were stored and analyzed using the SPSS 20.0 software programme.


Results

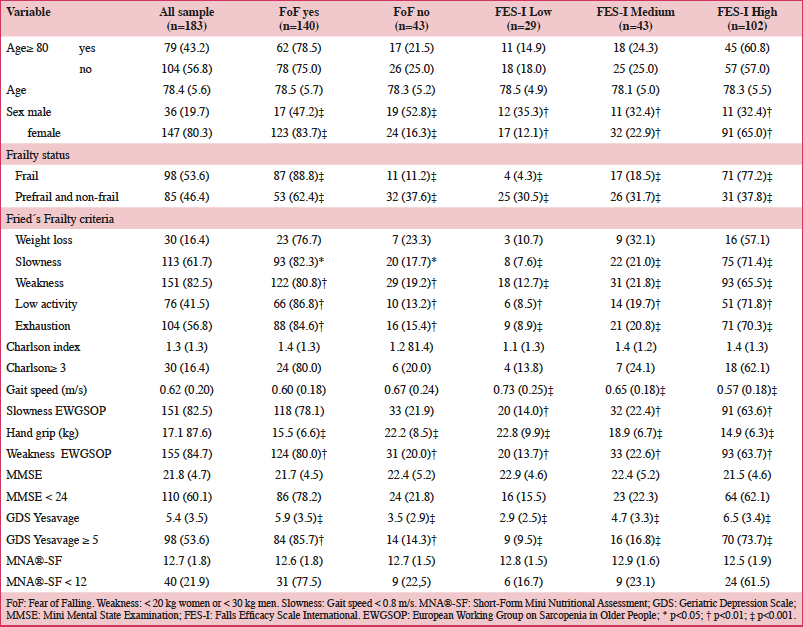
Table 1 presents the baseline characteristics of the global sample, and also categorized by FoF status. FoF was more prevalent in women than in men, but was not related neither to age nor comorbidity. Also, we couldn’t find association between neither nutritional status, nor cognitive decline with FoF.

Table 1: Baseline characteristics of the sample

Table 1: Baseline characteristics of the sample

FoF: Fear of Falling. Weakness: < 20 kg women or < 30 kg men. Slowness: Gait speed < 0.8 m/s. MNA®-SF: Short-Form Mini Nutritional Assessment; GDS: Geriatric Depression Scale; MMSE: Mini Mental State Examination; FES-I: Falls Efficacy Scale International. EWGSOP: European Working Group on Sarcopenia in Older People; * p<0.05; † p<0.01; ‡ p<0.001


However, there was a clear relationship between FoF and frailty. Based on the three questions, 88.8% of frail older adults presented FoF compared to 62.4% of those who were not frail. Furthermore, only 37.8% of non frail participants had a high concern of falling, compared to 77.2% of those who were frail measured with the FES-I. Analyzing every five components of the frailty phenotype, only weight loss was not associated with FoF. Slowness, weakness, and exhaustion were the three criteria with the highest association. In order to deepen in the association between frailty criteria and FoF, we also analyzed the association between EWGSOP criteria of weakness and slowness. More than 60% of participants with high concern of falling using the FES-I presented slowness and weakness when using EWGSOP cut-points, compared to 30% of those who did not meet EWGSOP criteria.
Regarding depression, 85.7% of participants with a GDS score greater than 4 presented FoF compared to 65.9% of those with lower GDS scores. Only 40.5% of those without depression risk had a high concern of falling, compared to 73.7% of those with depression risk.
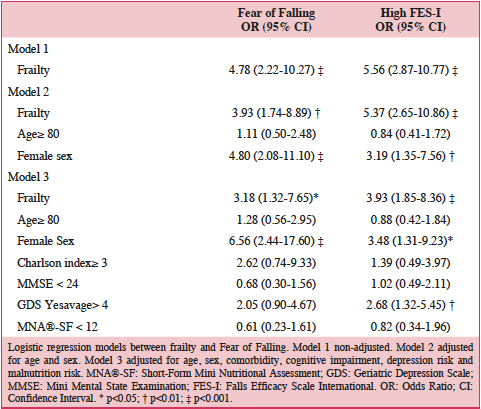
Finally, we designed three progressive logistic regression models in order to determine the adjusted relationship between frailty and FoF. Frail participants had an adjusted risk of FoF that was 3.18 (95% CI 1.32 to 7.65) higher compared to those who were not frail, assessed with the three questions. Similarly, frail participants had a 3.93 (95%CI 1.85 to 8.36) increased adjusted risk of presenting high concern of falling when using the FES-I scale, when compared to those non frail. Only female sex and depression risk were also associated to FoF in the final adjusted models.

Table 2: Models to determine independent association between Frailty and Fear of Falling

Table 2: Models to determine independent association between Frailty and Fear of Falling

Logistic regression models between frailty and Fear of Falling. Model 1 non-adjusted. Model 2 adjusted for age and sex. Model 3 adjusted for age, sex, comorbidity, cognitive impairment, depression risk and malnutrition risk. MNA®-SF: Short-Form Mini Nutritional Assessment; GDS: Geriatric Depression Scale; MMSE: Mini Mental State Examination; FES-I: Falls Efficacy Scale International. OR: Odds Ratio; CI: Confidence Interval. * p<0.05; † p<0.01; ‡ p<0.001.


Discussion

The main conclusion of our study is that frailty is independently associated to FoF in older adults with a previous fall. Frail older adults have a three to four-fold an adjusted increased risk of presenting FoF, depending on the instrument used to asses this syndrome. Furthermore, neither comorbidity, nor cognitive status, nor nutritional status are associated with this entity, and only female sex and depression risk are.
Frailty, one of the cornerstones of Geriatric Medicine (1), is very common among older adults who fall (16). In the Beijing Longitudinal Study of Aging, the Frailty Index was associated with an increased risk of recurrent falls (OR 1.54) (23), and in the Study of Osteoporotic Fractures (16), frail women had a higher age-adjusted risk of recurrent falls (OR 2.4). In our sample 53.6% of the participants were frail, confirming this association.
Falls and FoF share a common characteristic, namely mobility impairment (6), and both are associated with physical performance elements such as balance and strength (14). In a recent review, FoF was robustly associated with impaired physical function in community-dwelling older adults (24). In our study, four components of the Fried´s frailty criteria were associated with FoF, namely slowness, weakness, low physical activity and exhaustion, and only one, weight loss was not. Austin et al. found that older adults with FoF presented longer time to complete the Timed up and go test compared to those without fear (10.1 vs 9.0 seconds), and more commonly had a lack of physical activity (32.1% vs 19.5%), both components of the frailty syndrome, in agreement with our data (7).
It has been described that gait abnormalities can predispose an individual to reduced mobility and an increased likelihood of falling, and that FoF influences spatial and temporal gait parameter changes in older adults. Slower gait speed, shorter stride length, increased stride width, and prolonged double limb support time, have all been associated with a preexisting FoF (25). However, other authors have proposed that low gait speed associated with FoF, may be a useful adaptation to optimize balance, rather than a sign of decreased balance control. The reason is because the ability to attend to a secondary task during walking is not influenced by FoF (10). FoF is associated with an increase in gait variability and a recent meta-analysis concluded that the augmentation in stride time variability related to FoF should be considered as a biomarker of impairments of higher-level gait control (26). However, the authors discussed that the mixed results obtained in other studies suggest that cortical gait control impairment related to FoF is not as simple as believed and may require additional disorders, such as falling, to induce significant changes in gait control.
Knee muscle strength is an important and independent determinant of falls and the level of FoF in individuals with Parkinson´s Disease (27). In this population, reduced lower extremity muscle strength was associated with recurrent falls, and also with a lack of confidence in performing standing or walking activities. In our study there was a strong association between grip strength and FoF, probably suggesting that a global state of sarcopenia is associated with FoF, and not only lower limb muscle mass decline. Improving balance, gait stability and knee muscle strength could be crucial in promoting balance confidence (27).
The main limitation of our study is the cross-sectional design. We can´t demonstrate causality in the relationship between frailty and FoF, and longitudinal studies should be necessary to confirm this association. However, the rationale of the demonstrated association between frailty and falls makes also very plausible the association between frailty and FoF. In our study there were a high percentage of women (80%) and most of the participants presented FoF (76%). The relationship between female sex, frailty and falls is well described in the literature and for this reason in order to avoid bias, we included in our models sex as an important variable.


Conflict of Interest
There is no conflict of interest for any author.

Declaration of sources of funding
This work was supported by Instituto de Salud Carlos III, Ministerio de Economía y Competitividad, and Fondo Europeo de Desarrollo Regional (European Union) [grant numbert PI12/02180], and CIBERFES, Instituto de Salud Carlos III, Spain.


References

1.     Morley JE, Vellas B, van Kan GA, et al. Frailty consensus: a call to action. J Am Med Dir Assoc 2013;14:392-7.
2.    Collard RM, Boter H, Schoevers RA, Oude Voshaar RC. Prevalence of frailty in community-dwelling older persons: a systematic review. J Am GeriatrSoc 2012;60:1487-92.
3.    Romero Rizos L, Abizanda Soler P. Frailty as a predictor of adverse events in epidemiological studies: literature review. Rev Esp Geriatr Gerontol 2013;48:285-9.
4.    Tinetti ME, Richman D, Powell L. Falls efficacy as a measure of fear of falling. J Gerontol 1990;45:239–43.
5.    Arfken CL, Lach HW, Birge SJ, Miller JP. The prevalence of fear of falling in elderly persons living in the community. Am J Public Health 1994;84:566-70.
6.    Friedman SM, Munoz B, West SK et al. Falls and fear of falling: Which comes first? A longitudinal prediction model suggests strategies for primary and secondary prevention. J Am Geriatr Soc 2002;50:1329-35.
7.    Austin N, Devine A, Dick I, Prince R, Bruce D. Fear of falling in older women: a longitudinal study of incidence, persistence, and predictors. J Am Geriatr Soc 2007;55:1598-603.
8.    Scheffer AC, Schuurmans MJ, Van Dijk N, Van der Hooft T, de Rooij SE. Fear of falling: measurement strategy, prevalence, risk factors and consequences among older persons. Age Ageing 2008;37:19-24.
9.    Murphy SL, Dubin JA, Gill TM. The development of fear of falling among community-living older women: Predisposing factors and subsequent fall events. J Gerontol A Biol Sci Med Sci 2003;58A:M943-M947.
10.    Reelick M.F, Van Iersel MB, Kessels RP, Rikkert MG. The influence of fear of falling on gait and balance in older people. Age Aging 2009;38:435-440.
11.    Lach HW. Incidence and risk factors for developing fear of falling in older adults. Public Health Nurs 2005;22:45–52.
12.    Bruce DG, Devine A, Prince RL. Recreational physical activity levels in healthy older women: the importance of fear of falling. J Am Geriatr Soc 2002;50:84-9.
13.    Van Haastregt JC, Zijlstra GA, van Roosum E, van Eijk JT, Kempen GI. Feelings of anxiety and symptoms of depression in community-living older persons who avoid activity for fear of falling. Am J Geriatr Psychiatry 2008;16:186-93.
14.    Deshpande N, Metter EJ, Lauretani F, Bandinelli S, Guralnik J, Ferrucci L. Activity restriction induced by fear of falling and objective and subjective measures of physical function: a prospective cohort study. J Am Geriatr Soc 2008;56:615.
15.    Trombetti A, Reid KF, Hars M, et al. Age-associated declines in muscle mass, strength, power, and physical performance: impact on fear of falling and quality of life. Osteoporos Int 2016;27:463-71.
16.    Ensrud KE, Ewing SK, Taylor BC, et al. Frailty and risk offalls, fracture, and mortality in older women: the study of osteoporotic fractures. J Gerontol A Biol Sci Med Sci 2007;62:744-51.
17.    Morley JE. Frailty, falls, and fractures. J Am Med Direct Assoc 2013;14:149-51.
18.    Delbaere K, Crombez G, Vanderstraeten G, Willems T, Cambier D. Fear-related avoidance of activities, falls and physical frailty. A prospective community-based cohort study. Age Ageing 2004;33:368-73.
19.    Esbrí Víctor M, Huedo Rodenas I, López Utiel M, et al. Rationale, design and methodology of physical attributes identification of the fear of falling syndrome (FISTAC study). Rev Esp Geriatr Gerontol 2016;52:80-6.
20.    Yardley L, Beyer N, Hauer K, Kempen G, Piot-Ziegler C, Todd C. Development and initial validation of the Falls Efficacy Scale-International (FES-I). Age Ageing 2005;34:614-9.
21.    Delbaere K, Close JCT, Mikolaizak AS, Sachdev PS, Brodaty H, Lord SR. The Falls Efficacy Scale International (FES-I). A comprehensive longitudinal validation study. Age Ageing 2010;39:210-6.
22.    Fried LP, Tangen CM, Walston J, Newman AB, Hirsch C, Gottdiener J, et al. Frailty in Older Adults: Evidence for a Phenotype. J Gerontol A Biol Sci Med Sci 2001;56A:M146-M156.
23.    Fang X, Shi J, Song X, et al. Frailty in relation to the risk of falls, fractures, andmortality in older Chinese adults: Results from the Beijing longitudinal study of aging. J Nutr Health Aging 2012;16:903-7.
24.    Denkinger MD, Lukas A, Nikolaus T, Hauer K. Factors associated with fear of falling and associated activity restriction in community-dwelling older adults: a systematic review. Am J Geriatr Psychiatry 2015;23:72-86.
25.    Chamberlin ME, Fulwider BD, Sanders SL, Medeiros JM. Does fear of falling influence spatial and temporal gait parameters in elderly persons beyond changes associated with normal aging? J Gerontol A Biol Sci Med Sci 2005;60A:1163-7.
26.    Ayoubi F, Launay CP, Annweiler C, Beauchet O. Fear of falling and gait variability in older adults: a systematic review and meta-analysis. J Am Med Dir Assoc 2015;16:14-9.
27.    Mak MKY, Pang MYC, MOK V. Gait difficulty, postural instability, and muscle weakness are associated with fear of falling in people with parkinson’s disease. Parkinsons Dis 2012;2012:901721.

QUALITY INDICATORS OF NUTRITIONAL CARE PRACTICE IN ELDERLY CARE


M. Skinnars Josefsson1, M. Nydahl1, I. Persson2, Y. Mattsson Sydner1


1. Department of Food, Nutrition and Dietetics, Uppsala University, Sweden; 2. Department of Statistics, Uppsala University, Sweden.

Corresponding to: Malin Skinnars Josefsson, MSc, Department of Food, Nutrition and Dietetics, Uppsala University, Box 560, 751 22 Uppsala, Sweden, malin.skinnars.josefsson@ikv.uu.se, +46 18-471 23 95, +46 76-555 78 80

Care Weekly 2017;1:41-49
Published online November 9, 2017, http://dx.doi.org/10.14283/cw.2017.8

Please, note that this editorial was published also in the Journal of the Nutrition Healh and Aging (JNHA) https://link.springer.com/article/10.1007/s12603-017-0970-8


Abstract

Objectives: The aim is to explore the effects of antecedent, structural and process quality indicators of nutritional care practice on meal satisfaction and screened nutritional status among older adults in residential care homes.

Design: Data for this Swedish cross-sectional study regarding older adults living in residential care homes were collected by i) a national questionnaire, ii) records from the quality registry Senior Alert, iii) data from an Open Comparison survey of elderly care in 2013/2014. The data represented 1154 individuals in 117 of 290 Swedish municipalities.

Measurements: Meal satisfaction (%) and adequate nutritional status, screened by the Mini Nutritional Assessment Short Form (MNA-SF), were the two outcome variables assessed through their association with population density of municipalities and residents’ age, together with 12 quality indicators pertaining to structure and process domains in the Donabedian model of care.

Results: Meal satisfaction was associated with rural and urban municipalities, with the structure quality indicators: local food policies, private meal providers, on-site cooking, availability of clinical/community dietitians, food service dietitians, and with the process quality indicators: meal choice, satisfaction surveys, and ‘meal councils’. Adequate nutritional status was positively associated with availability of clinical/community dietitians, and energy and nutrient calculated menus, and negatively associated with chilled food production systems.

Conclusion: Municipality characteristics and structure quality indicators had the strongest associations with meal satisfaction, and quality indicators with local characteristics emerge as important for meal satisfaction. Nutritional competence appears vital for residents to be well-nourished.

Key words: Nutritional care practice, meal satisfaction, nutritional status, older adults, residential care homes.


Introduction

Quality indicators are commonly used to improve nutritional care practice in elderly care (1-3), and a range of different strategies has been described (4-6). These strategies comprise a complex range from organisational to individual aspects, requiring a package of multilevel and multicomponent approaches (7). Previous studies have found quality indicators, such as the presence of adapted guidelines and policies, and the systematic education of staff, to be meaningful for the improvement of nutritional care practices (8-10). These quality indicators, together with nutritional competence and attitude, are described as vital for achieving interventions addressing malnutrition (11-13). Studies of links between food service practice and residents’ risk of malnutrition have further reported that overall meal satisfaction and menu cycle length, among other quality indicators, are associated with nutritional status (14). Examples of additional quality indicators addressed in interventions seeking to improve the food intake of older adults living in residential care homes are the sensory properties of food, mealtime logistics, nutrient density, variety and personalised meals (15, 16). Meal choice, as an example of a personalised meal, is reported to help increase body weight (17) and meal satisfaction (18). Findings from these and other studies describe a notable relationship between quality indicators of nutritional care practice such as food service satisfaction, nutritional status and food choice (7, 17-19).
Swedish elderly care, which includes nutritional care practice, is recognised for its comprehensiveness and high quality (20). Yet malnutrition, with its consequences for the individual and society, is also a reality in Sweden (21, 22). To address these problems, national authorities have provided guidelines that aim to improve the nutritional care practices for older adults (23, 24). Further, to improve quality and for the systematic prevention of malnutrition among older adults, and as a support for research, a national quality registry was launched in 2010 (25). Follow-ups on quality indicators of the performed and perceived overall quality of elderly care are conducted annually (26). Thus, guidelines and quality indicators for nutritional care are available, but there is a lack of knowledge concerning the outcomes of these supportive strategies. Elderly care, and how it is delivered, is the responsibility of local political councils, i.e. municipalities. There is extensive local autonomy and varying conditions resulting in diverse outcomes. National guidelines and quality indicators are interpreted at local level, where the responsibility for nutritional care is held.
In this paper, we address nutritional care practice with a focus on quality indicators related to food service, ranging from organisational set-ups to the older adults’ evaluation of meals. By doing so, this study seeks to present a holistic perspective, guided by Donabedians’ model of quality of care (27). In this model, quality indicators can be categorised into structure, process and outcome, creating a causal relationship between them. In the model, structure refers to quality indicators belonging to organisational, material and human resources. Process refers to what is actually done in giving and receiving care. Outcome quality indicators refer to the results of the care provided (27, 28). The model has been used in numerous studies over the years, some concerning nutritional care practice in hospital or residential care home settings at an institutional level (3, 29, 30). As a development of the model, it has been suggested that antecedents of care are also incorporated into the original framework as these factors are expected to affect the structure, process and outcome (31). The antecedents of care involve the personal characteristics and environmental context of an individual outside the care chain, e.g. socio-demographics and age. To our knowledge, there are no previous studies that have incorporated the whole chain of organisational conditions for nutritional care practice in elderly care. Hence, the aim is to explore the effect of antecedent, structural and process quality indicators of nutritional care practice in relation to the outcomes meal satisfaction and screened nutritional status among older adults in residential care homes.


Method

Framed by the Donabedian model, this paper draws on merged data including results from i) a national questionnaire, ii) records from the quality registry Senior Alert (25), and iii) data from an Open Comparison survey of elderly care (26).
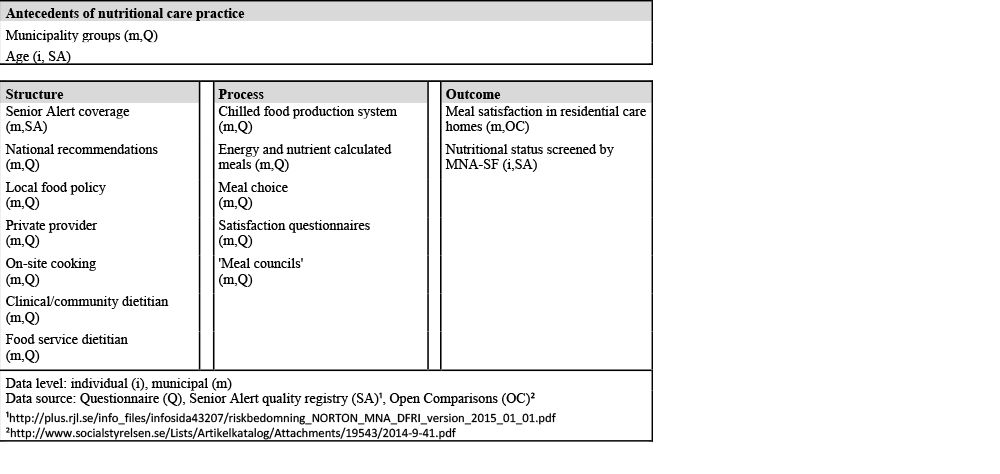
Between November 2013 and January 2014, a comprehensive national questionnaire developed by the authors was sent to all Swedish municipalities (n=290). The questionnaire, which had been pilot-tested for comprehensibility by food service dietitians, was distributed by e-mail with a cover letter. The cover letter informed that responses were voluntary and, although not anonymous, would be confidential and that individual municipalities would not be identified in the presentation of the results. Two reminders were sent to non-repliers and additional telephone call reminders were made by the first author to encourage further responses, reaching a final response rate of 56% (n=162). Eleven questions were selected to serve as quality indicators in this paper, and questions with answers on an ordinal scale were dichotomised for the analysis (Figure 1). The questions placed as quality indicators in the structure domain of the Donabedian model were: if municipalities consult the national recommendations concerning meals for older adults provided by the National Food Agency (1= yes, 0= no), presence of a local food policy (1= yes, 0= no), if the meal provision is contracted out to a private provider (1= yes for all, for most, for half of the units, 0= no, for a few units); if the meals were cooked on-site at the residential care homes (1= yes in all, in most, in half of the units, 0= no, in a few units), and if community/clinical dietitian(s) (1= yes one, yes several, 0= no) and/or food service dietitian(s) (1=yes one, yes several, 0= no) were available. The following questions were placed in the process domain: whether a cook-chill food production system was used (1= yes for all, most, half of the units, 0= no, for a few units), if meals were energy and nutrient calculated (1= yes all meals, lunch and dinner 0= lunch or dinner, no), if meal choices were offered for one or two main meals (1= yes for all, most, half of the units, 0= no, for a few units), if residents were frequently asked about their satisfaction with meals through questionnaires (1= yes, 0= no), and if meetings with representatives from the residents were held regularly where the menu and quality of food were discussed, called ‘meal councils’ in this study (1= yes, 0= no).

Figure 1: Source and data level of antecedents, structure, process and outcome quality indicators of nutritional care practice

Figure 1: Source and data level of antecedents, structure, process and outcome quality indicators of nutritional care practice


Data from the national quality registry Senior Alert (25) were anonymised on an individual but not on a municipal level, in order to make the data connectable to other sources in the analysis. If there were multiple registrations of an individual in the Senior Alert registry, only the first was included along with those registrations pertaining to municipalities participating in the questionnaire. The requested data covered the period January to March 2014 and comprised the areas of nutritional risk assessment of older adults residing in residential care homes. The measures in the quality registry are based on evidence. In 2013, all municipalities with the exception of four (n=286) contributed to the national quality registry although with varying coverage, i.e. varying proportions of their residents being included (32). The validated risk assessment tool used in the registry is the Mini Nutritional Assessment Short Form (MNA-SF) (33). According to MNA-SF screening, a person is considered malnourished with scores 0-7, at risk of malnutrition with scores 8-11 and well-nourished with scores 12-14. From the Senior Alert registry, the MNA-SF scores were placed in the outcome domain (1=well-nourished, 0= malnourished or at risk), and coverage in the registry was placed as a structure indicator (continuous variable) (Figure 1). To enable calculation of the MNA-SF score, only registrations with complete values for all items on the MNA-SF were included in the analysis.
Data from the Open Comparisons survey of elderly care in 2014 was obtained from the National Board of Health and Welfare (NBHW) (26). These self-reported data can be freely accessed at municipal level. All municipalities (n=290) participated in the 2014 survey, however some values were missing due to partially low internal response rates. For this paper, data on residents’ satisfaction with meals (%), represented by the question ‘In general, how does the food taste?’, was selected from the survey and placed as a second outcome indicator (Figure 1).
In order to control for antecedents of nutritional care practice, residents’ age and the population density of municipalities were the first indicators to be put into the model. Municipalities were grouped into rural, urban, and city using a classification based on population density, size and proximity to population agglomerations (34). Dummies were created for rural and urban municipality groups. Information on residents’ age was collected from the quality registry Senior Alert.

Data analysis

Data were analysed using the statistics program IBM SPSS version 22.0. After aggregating data from the different sources and excluding cases with missing values crucial for the analysis, the dataset contained 1154 individuals representing 117 of 290 Swedish municipalities. Descriptive statistics of the sample were compared by nutritional status (well-nourished and malnourished/at risk). Comparison of individual indicators on nutritional status was performed using Pearson’s χ2-test for categorical variables and one-way ANOVA for continuous variables. Before conducting a hierarchal regression analysis, Pearson’s correlation analysis was performed to investigate the bivariate relationship between the dependent variable satisfaction with meals and the explanatory variables. The hierarchical regression analysis created models introducing explanatory variables in the following steps: 1) antecedents of nutritional care practice, 2) structure quality indicators, and 3) process quality indicators. A binomial logistic regression was performed to ascertain the effects of structure and process quality indicators on the likelihood of older adults in residential care homes being screened as having adequate nutritional status (being well-nourished). In the model, the dependent variable was screened nutritional status (well-nourished or not). The statistical significance level for all analyses was set at 0.05 (significant result if p < .05). Multiple tests have been performed, which means that the total significance level is greater than the 5% used in a single test; the significance of the different test results must therefore be interpreted with care.


Results

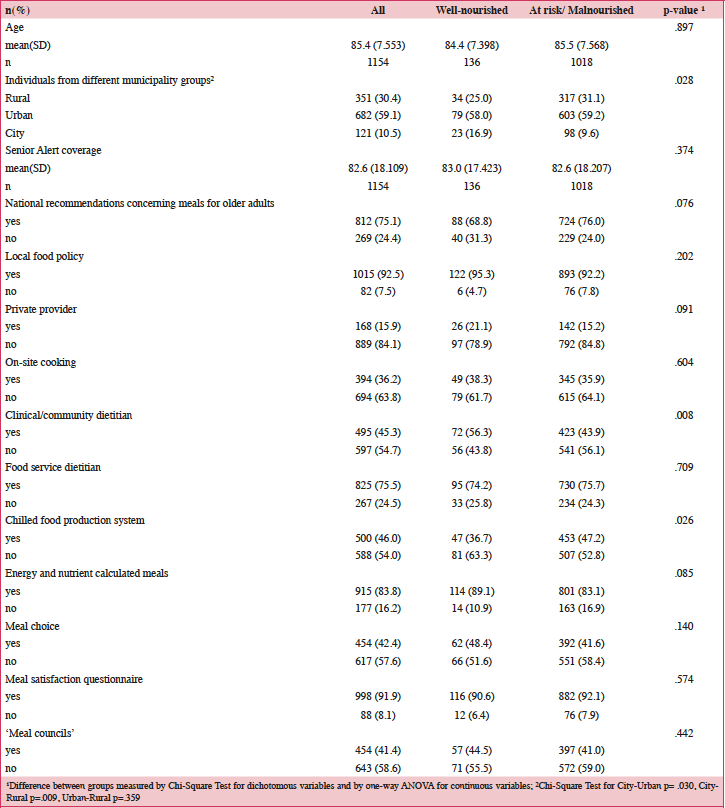
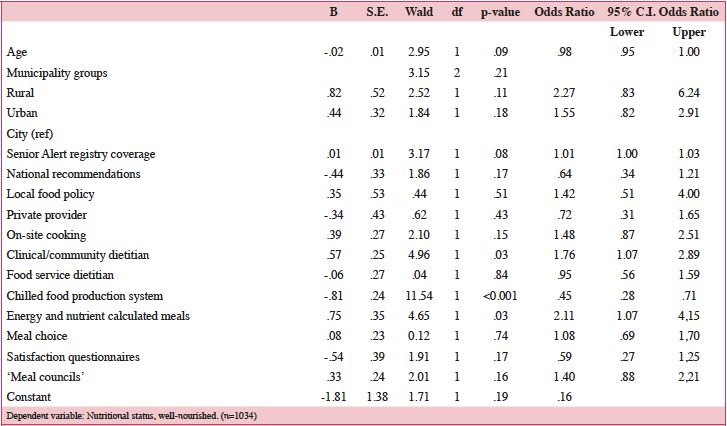
Table 1 shows the distribution of the antecedents of nutritional care practice, structure and process quality indicators for the nutritional status groups screened by MNA-SF. Rural, urban and city municipalities differed significantly regarding the proportion of individuals classified as well-nourished or at risk/malnourished (p=.028), with city municipalities having a higher proportion of well-nourished older adults. Availability of a clinical/community dietitian (p=.008) and chilled food production systems (p=.026) showed significant differences in their association with being well-nourished. Table 2 shows that one structure and two process indicators had a statistically significant association with screened nutritional status (well-nourished). The availability of a clinical/community dietitian was positively associated, odds ratio 1.76, and offering energy and nutrient calculated meals more than doubled the odds of being well-nourished, odds ratio 2.11, while the use of a chilled food production system was negatively associated with being well-nourished, odds ratio 0.45. The full model containing all indicators was statistically significant (χ2(15) = 38.441, p = .001), and explained approximately 7% (Nagelkerke R2) of the variance in scoring of being well-nourished by MNA-SF.

Table 1: Distribution of antecedent, structure and process quality indicators of nutritional care practice based on nutritional status (well-nourished or at risk/malnourished), (n=1154)

Table 1: Distribution of antecedent, structure and process quality indicators of nutritional care practice based on nutritional status (well-nourished or at risk/malnourished), (n=1154)

Table 2: Antecedents and quality indicators of nutritional care practice’s association with being well-nourished

Table 2: Antecedents and quality indicators of nutritional care practice’s association with being well-nourished


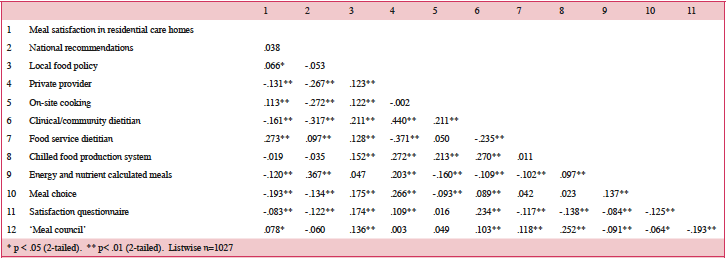
Table 3 describes the bivariate correlations between meal satisfaction and the explanatory variables. The strongest correlation was between meal satisfaction and food service dietitian (r=.273, p<.01), but overall the correlations with meal satisfaction were weak (r<±.3) although a majority had significant correlations. Based on this, we investigated the simultaneous relationship between a combination of explanatory variables and meal satisfaction. Overall, the correlations between the explanatory variables were also weak, which indicates a lack of multicollinearity problems. The moderate correlation between private provider and clinical/community dietitian (r=.440, p<.01) was the strongest correlation found. Table 4 summarises the results of the hierarchical regression analysis for meal satisfaction. In model 1, municipality groups and age together explained 3.1% of the total variance of satisfaction with meals for the study sample, of which residents in residential care homes in rural and urban municipalities were significantly more likely to be satisfied than residents in city municipalities. Model 2 added structure quality indicators and explained an additional 11.4% of the variance. Older adults in municipalities where private providers supplied the meals, meals were cooked at site and a food service dietitian was available, were more likely to be satisfied with meals, while availability of a clinical/community dietitian had a negative association with meal satisfaction. As a final step, process quality indicators were entered, producing a model that added another 3.7% of the variance of meal satisfaction being explained. This third and final model showed that older adults living in residential care homes using a chilled food production system, offering energy and nutrient calculated meals, and meal choices, were significantly less likely to be satisfied with meals. Local food policies entered in model 2, became significantly associated with meal satisfaction in the final model. The total variance explained by the full model was 18.2% (F (14,1000) = 31.085, p < .0001).

Table 3: Pearson’s product-moment correlations between bivariate quality indicators and meal satisfaction in residential care homes

Table 3: Pearson’s product-moment correlations between bivariate quality indicators and meal satisfaction in residential care homes


Discussion

Municipality characteristics (rural, urban or city) and the structure and process quality indicators in the Donabedian model had a more pronounced association with the outcome of meal satisfaction than screened nutritional status among older adults living in residential care homes. Meal satisfaction was positively associated with quality indicators pertaining to structure. These were, a local food policy, private provider, on-site cooking, and availability of food service dietitians. Meal satisfaction was negatively associated with availability of clinical/community dietitians, and all but one process indicators. For the outcome variable screened adequate nutritional status, two quality indicators were positively significant: availability of a clinical/community dietitian, and offering energy and nutrient calculated meals, while chilled food production systems was negatively associated.
In our study of quality indicators of nutritional care practice, local food policies and availability of clinical/community and food service dietitians stood out as considerable contributors. These structure quality indicators commonly provide the basis for the application of process quality indicators, such as choice of meals or energy and nutrition calculated menus. Overall, structure quality indicators were positively associated with meal satisfaction while those related to process were negatively associated. These results contradict the findings of Kajonius and Kazemi (35), who, in their study based on similar data, found that overall satisfaction with elderly care was determined by factors pertaining to process. However, as they also discuss, there is a need to evaluate how the structure and process quality indicators have been operationalised and chosen, and which outcome variables have been studied. In this study, our aim was to present a holistic perspective ranging from organisational set-ups to individual evaluation of meals. However, the quality indicators chosen focus on aspects of food service, representing one of many areas in this multidimensional and complex field of nutrition care practice. This makes it difficult not only to compare different studies but also to evaluate the impact of the results between structure and process domains. Instead, we suggest focusing on their joint effect as a link to the outcome variable when interpreting the results, which we regard as contributing to this broad field.
Local food policies that are adapted to local conditions and produced within the organisation related positively to meal satisfaction, although they did not significantly associate with adequate nutritional status. These results are in line with a study by Meijer et al, where no structural quality indicators were found to be good predictors of malnutrition over time (29).  However, with the objective of improving daily care and food service satisfaction of older adults, a need for practical guidelines has been underscored in studies by e.g. Volkert and Wright et al. (36, 37), along with a need for ensuring their effectiveness (38).
One of the positive associations with meal satisfaction was cooking on-site. Through providing greater flexibility, cooking on-site is beneficial for the individual resident making personal requests easier to address than if meals come ready prepared (39). One plausible explanation for the negative association between chilled food production systems and both outcome variables is that a chilled food production system often requires reduced transportation frequency due to long distances, thus limiting flexibility. Another explanation could be a perceived impaired sensory quality of the food since it is chilled and reheated (40). Further, the negative association between meal satisfaction and energy and nutrient calculation of meals is puzzling but, like the findings of Wright et al, might be explained by a desire for comfort foods on the elderly care menu (36); comfort food that does not necessarily meet nutritional requirements. In addition, the classic dishes served might not contain the ‘traditional’ ingredients and condiments due to lack of awareness or to making restrictions in order to meet nutritional requirements. Hence, the traditional culinary rules are not followed and the symbolic meaning of the dish is lost (41).
The quality indicator meal choice in our study also associated negatively with meal satisfaction, and contradicts the results of Wright et al (36). As described by Kenkmann and Hooper, choices could be withheld from residents during hectic times, or that residents not always made choices even if possible, but instead trusted care staff to make the choices for them (42). With the strongest association, the importance of food service dietitians for the likelihood of older adults being satisfied with meals, is also confirmed in this study, as is the importance of clinical/community dietitians for adequate nutritional status, while an explanation for the negative association between clinical/community dietitians and meal satisfaction is inexplicable.
Although challenging to assess, satisfaction as a quality indicator is emphasised by Donabedian as a core value in care (28). Meal satisfaction as a quality indicator is presented in numerous studies as influencing dietary intake and overall satisfaction (36, 43, 44). However, the problem of finding appropriate measurement strategies has been discussed, since older adults living in residential care homes might have difficulty expressing themselves, due to suffering from dementia or other cognitive impairments (45). These residents are also less inclined to complain about meals (19).
Even if the MNA-SF is a screening tool and therefore does not guarantee qualitative nutritional care, it is valuable for early recognition of risks among older adults where there is an intention to generate dietetic interventions (46). Since it is utilised by a variety of healthcare professionals, there may be differences in interpretation of the screening tool with the risk of obtaining misleading results. However, MNA-SF is considered to be a robust screening tool regardless of the training or professional background of those using it (47). There is no doubt that nutritional status as an outcome indicator is fundamental and essential to consider due to the considerable prevalence of malnutrition in elderly care (37, 48-50).
The results in this study rely on self-reported data, which can be considered a limitation and a reliability risk. The annual open comparison surveys are directed to the older adult, but instructions encourage responders to ask for assistance if they need help in responding. According to the NBHW, those reporting poor health in the survey were more inclined to ask for help and these responses were more negative (26). We do not know the proportion of independent responders in our study. Strengths of this study include the overall comprehensiveness through the use of rich nationwide databases with evidence-based settings and the practical implications for elderly care organisations. Further, a potential drawback of our data is that it ranged from an individual to a municipal level. This was however a prerequisite for performing the various analyses of the conceptual model including the whole chain from antecedents of nutritional care practice to outcomes. Future research would benefit from incorporating additional quality indicators in order to further understand important associations and predictors of nutritional care practice, and the outcome of interventions building on this knowledge.


Conclusions

This study contributes insight into the association of quality indicators of nutritional care practice and their link to meal satisfaction and screened nutritional status, focusing on aspects of food service in elderly care. Considering the nature of the Donabedian model, which implies a causal chain with process indicators building on structure, the positive association between structure quality indicators and the negative association with process quality indicators regarding meal satisfaction can be interpreted in several ways. One is that the older adults are confident in the local organisation to provide optimal nutritional care, and that active participation such as choosing meals, or part taking in questionnaires, is unwanted. The other interpretation is that the negative association with process indicators is a sign of system malfunction, where for example meal choices might be withheld from the residents and hence a service only in theory. Further, for meal satisfaction the significant associations with quality indicators were many, whereas significant associations with screened nutritional status were few. This discrepancy might be explained by the different data levels for the two outcome variables. Compiling associations with both of them, clinical/community dietitians as well as food service dietitians stand out as central, and the chilled food production system appear to be an unhelpful factor in the nutritional care practice with its negative association with both meal satisfaction and being well-nourished.


Acknowledgements: We thank the survey participants and the quality registry Senior Alert for the data and ‘Stiftelsen Kronprinsessan Margarets minne’ for funding the study.

Conflict of interests
There was no conflict of interest for any of the authors.

Ethical approval
Ethical approval was received by an advisory statement from the Regional Ethical Review Board of Medical Sciences in Uppsala (ref. no. 106 2013/386/1).

Authorship
MSJ was responsible for the development of the study, data collection, analysis, and drafting of the manuscript. YMS and MN supervised the study and contributed to drafting and editing the manuscript. IP was involved in the data analysis and editing the manuscript. All authors approved the final version of the paper.

Open Access
This article is distributed under the terms of the Creative Commons Attribution 4.0 International License (http://creativecommons.org/licenses/by/4.0/), which permits use, duplication, adaptation, distribution and reproduction in any medium or format, as long as you give appropriate credit to the original author(s) and the source, provide a link to the Creative Commons license and indicate if changes were made.


References

1.     van der Pols-Vijlbrief R, Wijnhoven HAH, Schaap LA, Terwee CB, Visser M. Determinants of protein-energy malnutrition in community-dwelling older adults: A systematic review of observational studies. Ageing Res Rev 2014;18:112-131.
2.    Dupuy C, de Souto Barreto P, Ghisolfi A, Guyonnet S, Dorigny B, Vellas B, et al. Indicators of oral nutritional supplements prescription in nursing home residents: A cross-sectional study. Clin Nutr 2016;35(5):1047-1052.
3.    van Damme N, Buijck B, van Hecke A, Verhaeghe S, Goossens E, Beeckman D. Development of a quality of meals and meal service set of indicators for residential facilities for elderly. J  Nutr Health Aging 2015;20(5):471-477.
4.    Abbott RA, Whear R, Thompson-Coon J, Ukoumunne OC, Rogers M, Bethel A, et al. Effectiveness of mealtime interventions on nutritional outcomes for the elderly living in residential care: A systematic review and meta-analysis. Ageing Res Rev 2013;12(4):967-81.
5.    Tamura BK, Bell CL, Masaki KH, Amella EJ. Factors Associated with weight loss, low BMI, and malnutrition among nursing home patients: A Systematic Review of the Literature. J Am Med Dir Assoc 2013;14(9):649-655.
6.    Kimber K, Gibbs M, Weekes CE, Baldwin C. Supportive interventions for enhancing dietary intake in malnourished or nutritionally at-risk adults: a systematic review of nonrandomised studies. J Hum Nutr Diet 2015;28(6):517-545.
7.    Vucea V, Keller HH, Ducak K. Interventions for improving mealtime experiences in long-term care. J Nutr Gerontol Geriatr 2014;33(4):249-324.
8.    Westergren A, Hedin G. Do study circles and a nutritional care policy improve nutritional care in a short- and long-term perspective in special accommodations? Food Nutr Res 2010;54(1):5402-5409.
9.    van Nie NC, Meijers JMM, Schols JMGA, Lohrmann C, Spreeuwenberg M, Halfens RJG. Do structural quality indicators of nutritional care influence malnutrition prevalence in Dutch, German, and Austrian nursing homes? Nutrition 2014;30(11–12):1384-1390.
10.    Pezzana A, Cereda E, Avagnina P, Malfi G, Paiola E, Frighi Z, et al. Nutritional care needs in elderly residents of long-term care institutions: Potential implications for policies. J Nutr Health Aging 2015;19(9):947-954.
11.    Leslie WS. Improving the dietary intake of frail older people. Proc Nutr Soc 2011;70(2):263-7.
12.    Lorefält B, Andersson A, Wirehn AB, Wilhelmsson S. Nutritional status and health care costs for the elderly living in municipal residential homes – An intervention study. J Nutr Health Aging 2011;15(2):92-97.
13.    Beck A, Andersen UT, Leedo E, Jensen LL, Martins K, Quvang M, et al. Does adding a dietician to the liaison team after discharge of geriatric patients improve nutritional outcome: a randomised controlled trial. Clin Rehabil 2015;29(11):1117-1128.
14.    Carrier N, Ouellet D, West GE. Nursing home food services linked with risk of malnutrition. Can J Diet Pract Res 2007;68(1):14-20.
15.    Keller H, Beck AM, Namasivayam A. Improving food and fluid intake for older adults living in long-term care: A research agenda. J Am Med Dir Assoc 2015;16(2):93-100.
16.    Hedman S, Nydahl M, Faxén-Irving G. Individually prescribed diet is fundamental to optimize nutritional treatment in geriatric patients. Clin Nutr 2016;35(3):692-698.
17.    Crogan NL, Dupler AE, Short R, Heaton G. Food choice can improve nursing home resident meal service satisfaction and nutritional status. J Gerontol Nurs 2013;39(5):38-45.
18.    Kenkmann A, Price GM, Bolton J, Hooper L. Health, wellbeing and nutritional status of older people living in UK care homes: an exploratory evaluation of changes in food and drink provision. BMC geriatrics. 2010;10(1):28.
19.    Crogan NL, Short R, Dupler AE, Heaton G. The influence of cognitive status on elder food choice and meal service satisfaction. Am J Alzheimer’s Dis Other Dem 2015;30(7):679-685.
20.    Olsen GM. What’s ‘left’ in the ‘Garden of Sweden’? Int J Health Services 2013;43(1):7-30.
21.    Söderström L, Thors Adolfsson E, Rosenblad A, Frid H, Saletti A, Bergkvist L. Mealtime habits and meal provision are associated with malnutrition among elderly patients admitted to hospital. Clin Nutr 2013;32(2):281-288.
22.    Borgström Bolmsjö B, Jakobsson U, Mölstad S, Östgren CJ, Midlöv P. The nutritional situation in Swedish nursing homes – A longitudinal study. Archives Gerontol Geriatr 2015;60(1):128-33.
23.    National Board of Health and Welfare. Näring för god vård och omsorg: en vägledning för att förebygga och behandla undernäring [Nutrition for good care: a guide to prevent and treat malnutrition]. Stockholm: Socialstyrelsen; 2011.
24.    Swedish National Food Agency. Bra mat i äldreomsorgen [The recommendations Good meals in elderly care]. Livsmedelsverket; 2011.
25.    Edvinsson J, Rahm M, Trinks A, Höglund PJ. Senior alert: A quality registry to support a standardized, structured, and systematic preventive care process for older adults. Qual Manag Health Care 2015;24(2):96.
26.    National Board of Health and Welfare. Öppna jämförelser 2014. Vård och omsorg om äldre: jämförelser mellan kommuner och län [Open Comparisons 2014. Elderly care: Comparisons between municipalities and counties]. Stockholm: Socialstyrelsen 2015.
27.    Donabedian A. Evaluating the quality of medical care. Milbank Mem Fund Qual 1966;44(3):Suppl:166-206.
28.    Donabedian A. The quality of care: How can it be assessed? JAMA 1988;260(12):1743-8.
29.    Meijers JM, Tan F, Schols JM, Halfens RJ. Nutritional care; do process and structure indicators influence malnutrition prevalence over time? Clin Nutr 2014;33(3):459-465.
30.    Persenius M, Hall-Lord ML, Wilde-Larsson B, Carlsson E. Clinical nursing leaders’ perceptions of nutrition quality indicators in Swedish stroke wards: A national survey. J Nurs Manag 2015;23(6):705-715.
31.    Coyle YM, Battles JB. Using antecedents of medical care to develop valid quality of care measures. Int J Qual Health Care 1999;11(1):5-12.
32.    Henriks G, Edvinsson J, Trinks A. Årsrapport 2013 Senior alert [Annual review 2013 Senior Alert]. http://plus.rjl.se/info_files/infosida40605/Arsrapport_Senior_alert_2013.pdf: Senior alert; 2013.
33.    Kaiser MJ, Bauer JM, Ramsch C, Uter W, Guigoz Y, Cederholm T, et al. Validation of the Mini Nutritional Assessment short-form (MNA®-SF): A practical tool for identification of nutritional status. J Nutr Health Aging 2009;13(9):782-788.
34.    Growth Analysis. Better statistics for better regional and rural policy. Report 2014:04. http://www.tillvaxtanalys.se/in-english/publications/reports/reports/2014-04-04-better-statistics-for-better-regional-and-rural-policy.html: Tillväxtanalys; 2014.
35.    Kajonius PJ, Kazemi A. Structure and process quality as predictors of satisfaction with elderly care. Health Soc Care Community 2016;24(6):699-707.
36.    Wright ORL, Connelly LB, Capra S, Hendrikz J. Determinants of foodservice satisfaction for patients in geriatrics/rehabilitation and residents in residential aged care. Health Expectations 2013;16(3):251-265.
37.    Volkert D. Malnutrition in older adults-urgent need for action: A plea for improving the nutritional situation of older adults. Gerontology 2013;59(4):328-333.
38.    Woods JL, Walker KZ, Iuliano-Burns S, Strauss BJ. Malnutrition on the menu: Nutritional status of institutionalised elderly Australians in low-level care. J Nutr Health Aging 2009;13(8):693-8.
39.    Burger C, Kiesswetter E, Gietl A, Pfannes U, Arens-Azevedo U, Sieber CC, et al. Size matters! Differences in nutritional care between small, medium and large nursing homes in Germany. J Nutr Health Aging 2016:1-9.
40.    Mavrommatis Y, Moynihan PJ, Gosney MA, Methven L. Hospital catering systems and their impact on the sensorial profile of foods provided to older patients in the UK. Appetite 2011;57(1):14-20.
41.    Sydner Mattsson Y, Fjellström C. The meaning of symbols of culinary rules. J Foodservice 2006;17(4):182.
42.    Kenkmann A, Hooper L. The restaurant within the home: Experiences of a restaurant-style dining provision in residential homes for older people. Qual Ageing Older Adults 2012;13(2):98-110.
43.    Barnes S, Wasielewska A, Raiswell C, Drummond B. Exploring the mealtime experience in residential care settings for older people: An observational study. Health Soc Care Community 2013;21(4):442-450.
44.    Pizzola L, Martos Z, Pfisterer K, de Groot L, Keller H. Construct validation and test–retest reliability of a mealtime satisfaction questionnaire for retirement home residents. J Nutr Gerontol Geriatr 2013;32(4):343-359.
45.    Simmons SF, Cleeton P, Porchak T. Resident complaints about the nursing home food service: Relationship to cognitive status. J Gerontol Ser B Psychol Sci Soc Sci 2009;64(3):324-327.
46.    Kellett J, Kyle G, Itsiopoulos C, Naunton M. Nutrition screening practices amongst Australian residential aged care facilities. J Nutr Health Aging 2016;20(10):1040-1044.
47.    Win AZ, Ceresa C, Arnold K, Allison TA. High prevalence of malnutrition among elderly veterans in home based primary care. J Nutr Health Aging 2017:1-4.
48.    Törmä J, Winblad U, Cederholm T, Saletti A. Does undernutrition still prevail among nursing home residents? Clin Nutr 2013;32(4):562-568.
49.    Verbrugghe M, Beeckman D, Van Hecke A, Vanderwee K, Van Herck K, Clays E, et al. Malnutrition and associated factors in nursing home residents: A cross-sectional, multi-centre study. Clin Nutr 2013;32(3):438-443.
50.    Johansson L, Wijk H, Christensson L. Improving nutritional status of older persons with dementia using a national preventive care program. J Nutr Health Aging 2017;21(3):292-298.